
Building
performance
intelligence
Buildings
drift quietly.
Most buildings aren’t broken. They’re simply working harder than they should, consuming more energy, delivering less and carrying risks that often go unseen.
GRIOTech combines building-services engineering and intelligent technology to reveal hidden inefficiencies, understand their consequences and help close the gap between design and operation.
ABIE / Building performance · Reduced motion: use the timeline.
The problem
A growing gap
between working
and performing.
A building can maintain comfort while requiring progressively more mechanical effort. Conditions feel normal, even as hidden faults and operating exceptions make the systems work harder.
Higher score = less effort
vs day 0 · same comfort
Normal operation. No fault introduced yet.
Normal operation. Fault investigations follow the timeline as conditions emerge from day 16.
Independent evidence
The consequences are measurable.
The causes are harder to see.
Buildings can keep functioning while faults go unnoticed. Independent research examines how common these conditions are, how measurement errors affect energy use and how consequences reach connected equipment.
View supporting researchField records
Of AHUs had a reported fault on an average day in the study dataset.
Crowe et al.
Read field studyContext & limits
Multi-year FDD records covered more than 60,000 equipment items. The AHU result relates to 3,660 air handlers; a fault reported for any part of a day counted for that day.
Reported prevalence, not an energy-waste percentage or a savings estimate. The sample is not a census of all buildings.
EnergyPlus simulation
Heating energy from a +2°C supply-air temperature sensor offset.
Berkeley Lab
Read simulation paperContext & limits
In a modelled Chicago large-office HVAC system, a +2°C supply-air-temperature sensor offset increased heating/boiler energy by 18.08%, rounded here to 18%. The same scenario produced +6.87% cooling/chiller energy, +12.14% pump energy and −5.05% fan energy.
These separate end-use percentages are not additive. The headline concerns heating energy, not whole-building electricity or overall energy consumption. This is a verified simulation result, not a prediction of ABIE savings.
Winter experiment
Heat-pump electrical energy with an AHU fresh-air damper stuck fully open in a winter test.
Rosato et al.
Read experimentContext & limits
Controlled tests of a constant-air-volume AHU in southern Italy compared faulted and normal operation under similar boundary conditions. The reported 80.75% heat-pump increase is rounded to 81%.
Heat-pump energy only. The tested system's total electricity increase was 9.94%; this is neither whole-building consumption nor a sensor-drift result.
Separate studies, different boundaries. These figures are not ABIE savings or forecasts for your building.
Hidden consequences
One fault.
Multiple
consequences.
A single fault can affect several connected systems, increasing energy use, compromising service and creating wider operational exposure. Yet conventional fault reporting can present these consequences as separate issues, making it difficult to understand where they originate — or which problem deserves attention first.
Explore the Performance ChainABIE / Building performance · Passing AHU cooling valve
Cooling follows demand.
The AHU valve modulates as required. Primary circulation and variable-flow secondary distribution serve the cooling coil; local heating responds independently to zone demand.
The missing capability / Today’s building technology
Built to show.
Not to judge.
Building management systems, fault detection platforms, smart building operating systems and digital twins each offer a different view of operation.
Some platforms already provide advanced analysis and verification. Bringing these capabilities together still calls for continuous, connected judgement: understanding what matters, why it’s happening, what the consequences are and whether corrective action has actually worked.
What’s happening?
Building management systems and analytics help reveal how equipment is operating through readings, trends, schedules and control information.
Contribution
Make operation visible.
Supply air temperature, valve command and fan status can be read together on a trend.
These readings help us see how the building is operating. Understanding their significance means asking whether that operation is appropriate for the conditions and the service being required.
These are typical primary purposes, not capability limits.
What if the building could explain itself?
The solution / The Continuous Audit
From established disciplines to continuous understanding.
The Continuous Audit brings established building-performance disciplines into one ongoing process: evaluating performance, understanding causes and consequences, communicating what matters and verifying the outcome of corrective action.
Controls / BMS
Plant operation · measured behaviour
Energy management
Consumption · demand · reference
FDD & analytics
Exceptions · detection rules
Building models
Topology · operational context
Standardise
Common component, system and building assessments.
Qualify
Input provenance, evidence quality and visible gaps.
Reason
System 2 investigates connected evidence beyond detection.
Communicate & verify
Supported conclusions, attention and outcome assessment.
Performance ChainConnected equipment · operating context · impact relationships
The Continuous Audit
An ongoing judgement of building performance.
- Evaluate
- Investigate
- Assess consequences
- Communicate & act
- Verify
Outcome evidence informs the next evaluation.
From watching a building operate to understanding how well it performs.
Five principles
Continuous in operation
Building performance assessed as conditions change.
Continuous: Read more
Not just during commissioning, an annual audit or after a complaint. Operational behaviour is assessed continuously against the building’s intended purpose.
Causal in reasoning
Investigate underlying causes, not just detected symptoms.
Causal: Read more
Trace relationships across connected plant, distribution systems and served spaces to distinguish originating faults from their downstream and upstream consequences.
Explicit about exposure
Establish operational consequences across energy, service, risk and assurance.
Exposure: Read more
Evaluate recoverable value, service withheld, risk, assurance and observability as distinct forms of operational exposure. Do not force every consequence into a financial value.
Clear in communication
Explain what matters, why it matters and what needs attention in plain language.
Briefing: Read more
Translate complex operational evidence into clear findings, relevant context, priorities and recommended attention.
Verified in outcome
Assess whether corrective action achieved the intended result.
Verified: Read more
Evaluate what happened after corrective action and establish whether the intended operating outcome has been restored, using suitable evidence and baselines.
The potential / Continuous Performance Audit
What continuous understanding makes possible.
Use the findings to prioritise engineering work, protect service and check the results.
Energy
Recover unnecessary consumption.
Identify and quantify avoidable energy use, creating opportunities to reduce operating expenditure.
Service
Protect the conditions that matter.
Recognise deteriorating service delivery and prioritise corrective attention before problems become more disruptive.
Risk
Understand operational exposure.
Make previously hidden resilience, assurance and equipment-performance concerns more visible and actionable.
Operations
Make engineering effort count.
Focus investigations and maintenance resources on issues with meaningful, evidence-supported consequences.
Verification
Know whether actions worked.
Compare performance before and after intervention instead of assuming that closing a fault means resolving its impact.
Accountability
Build confidence in performance.
Give owners, operators and engineers a more consistent understanding of building performance and the basis for decisions.
A Continuous Audit reveals opportunities; engineering action and subsequent verification establish what has actually improved.
Introducing ABIE V2
From observation
to understanding.
ABIE V2 is GRIOTech’s implementation of the Continuous Audit: a building intelligence ecosystem that connects operational evidence, reasons across building systems, quantifies performance exposure and supports action through to verification.
Scroll within this view to explore.
A higher standard
Every building.
One standard
of accountability.
Different buildings. Different demands. One consistent approach to measuring performance, understanding exposure and verifying outcomes.
Measured against its purpose.
Judged in its operating context.
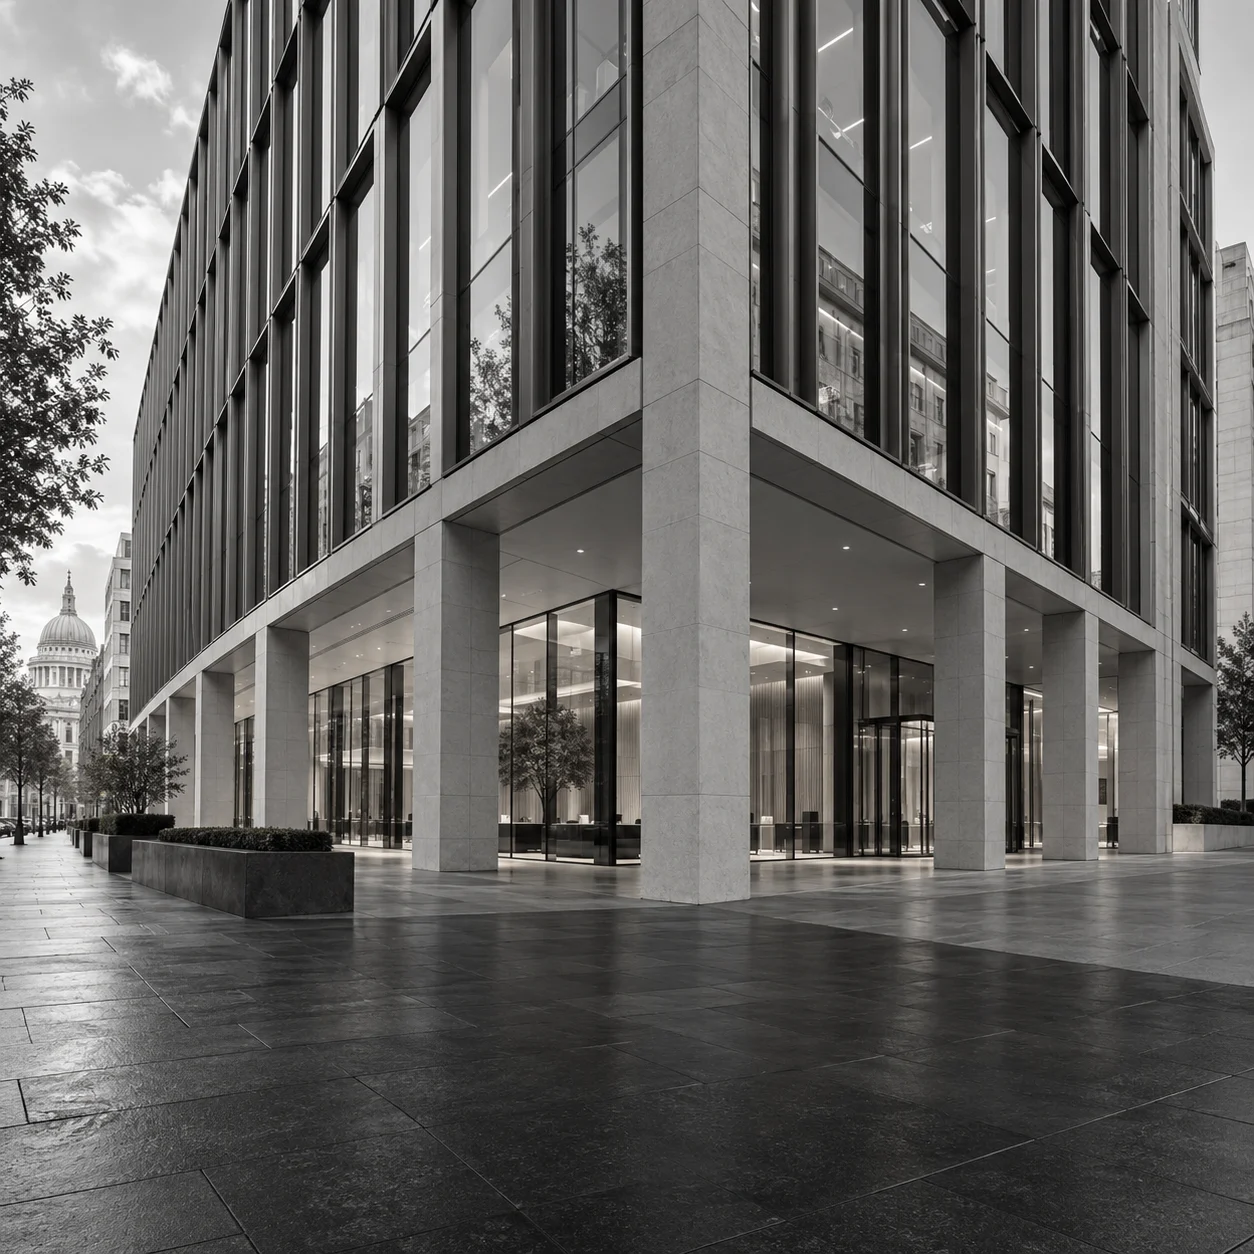
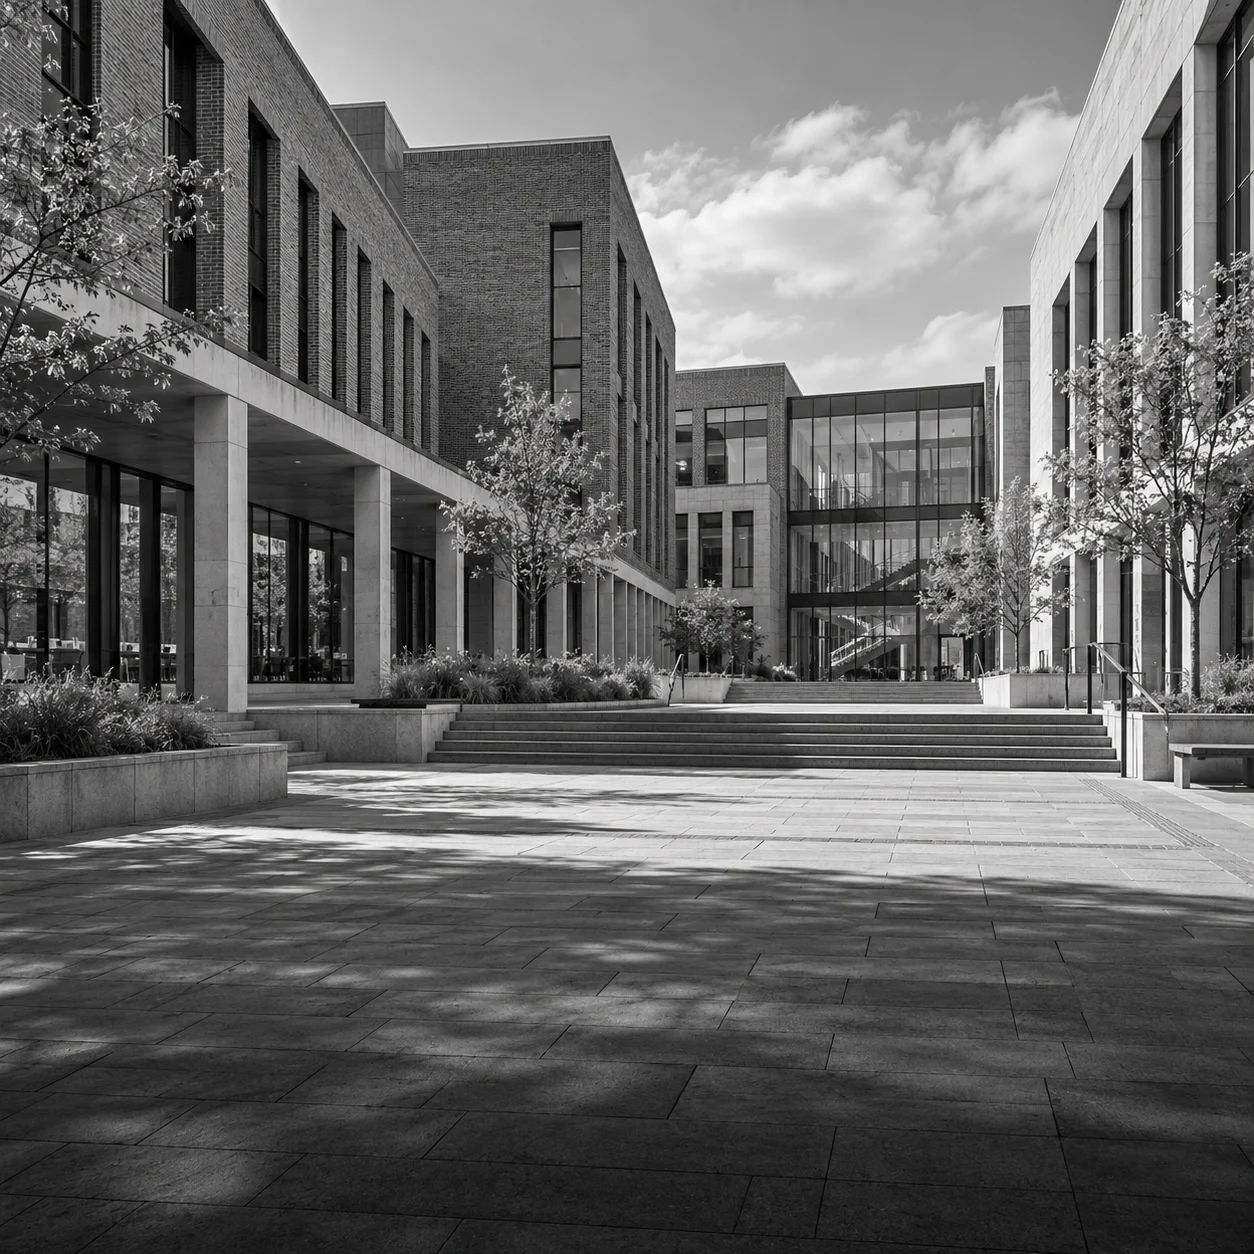
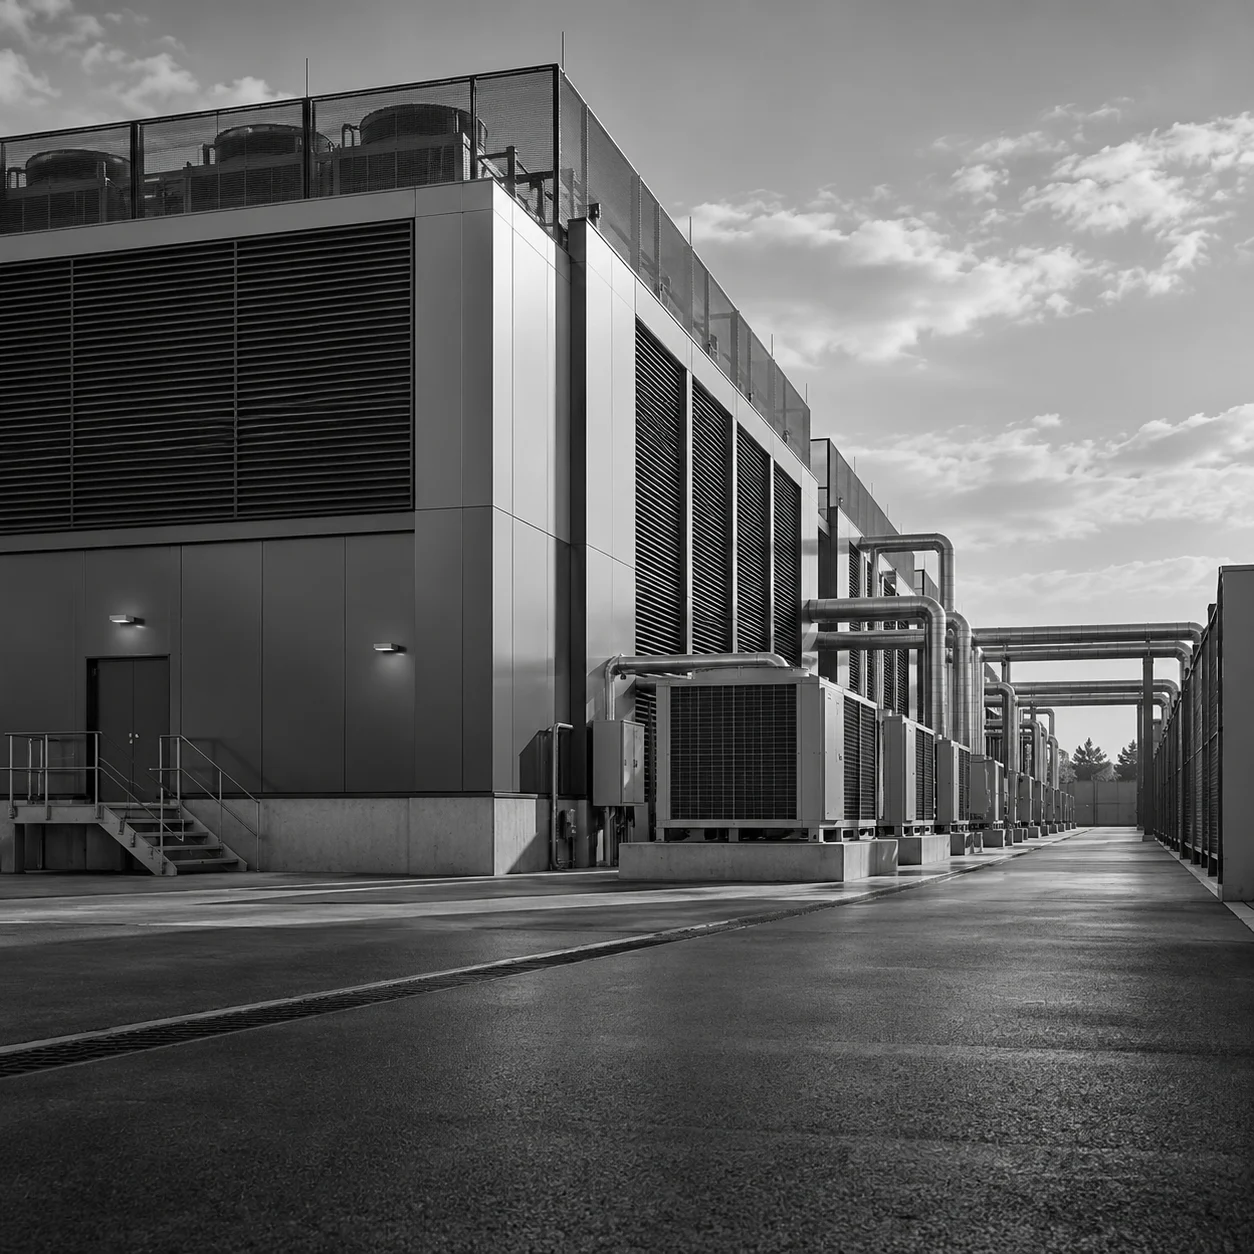
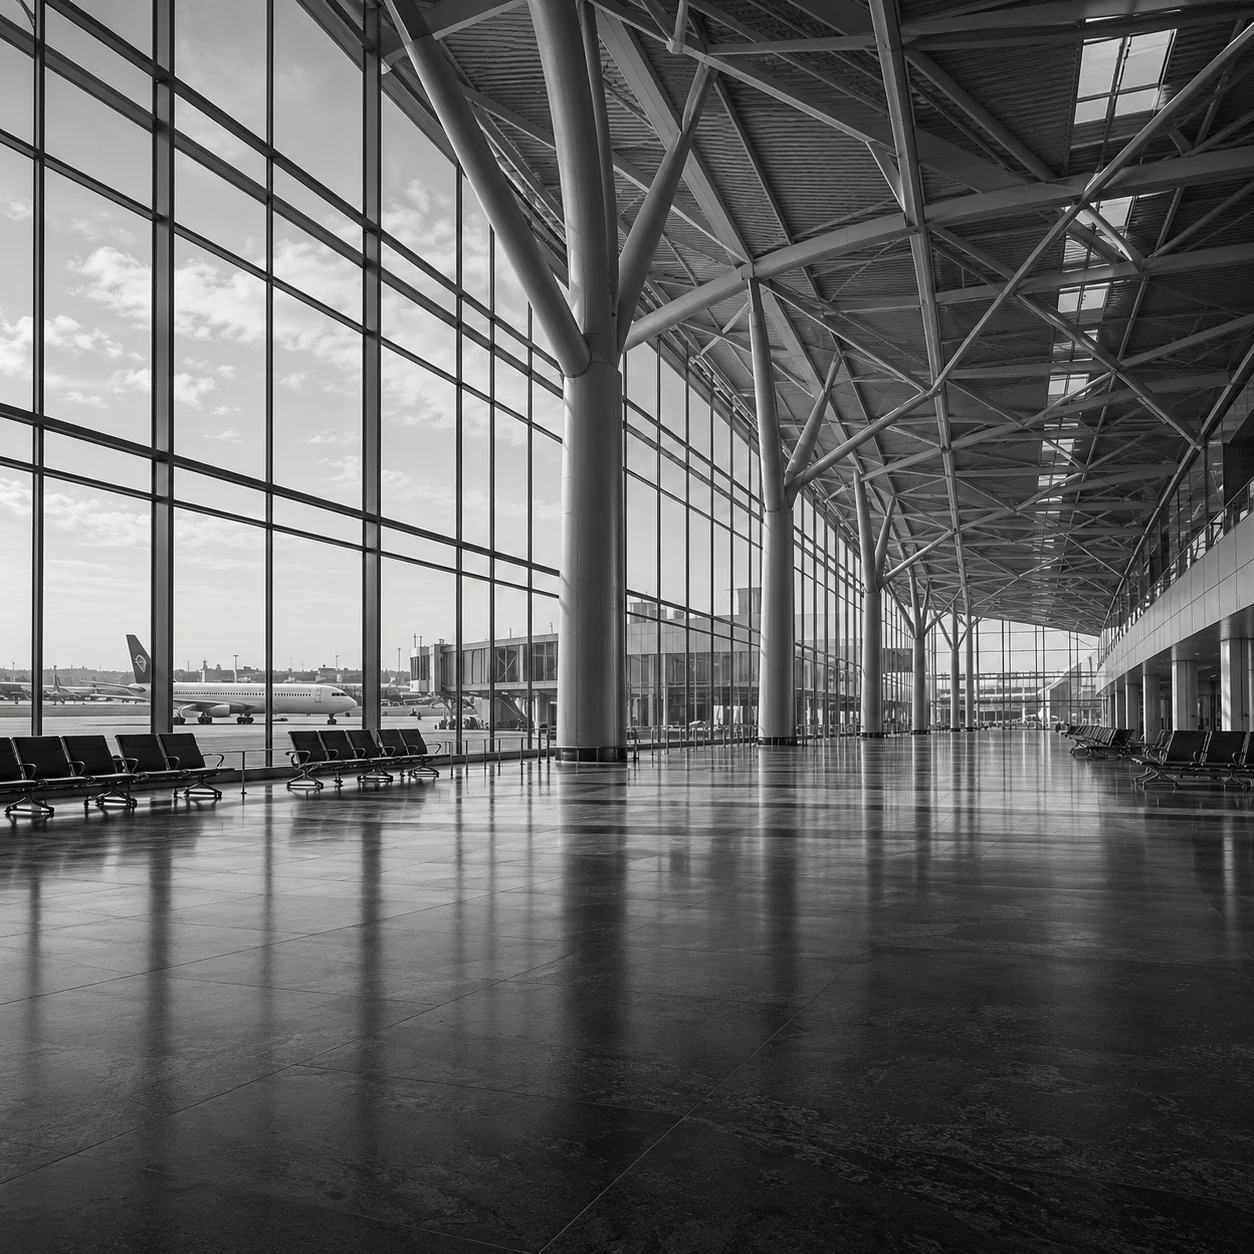
01 / Commercial Offices
- Comfort / Service Delivery
- 92 out of 100. Contextual service index.
Contextual service index
- Mechanical Effort
- 64 out of 100. Higher score · less effort.
Higher score · less effort
- Recoverable value
- £12,000 per year, estimated recoverable value.
Estimated / year
Operational finding
Simultaneous heating and cooling.
Estimated annual recovery from fixing eleven Level 3 cooling actuators at the same comfort level.
Commercial Offices. Comfort / Service Delivery 92 out of 100. Mechanical Effort score 64 out of 100; higher means less effort. Recoverable value: £12,000 per year, estimated recoverable value. Simultaneous heating and cooling.