01 / ABIE Platform
ABIE / Advanced Building Intelligence Ecosystem
One intelligence platform.
Three experiences.
Continuous building-performance intelligence, made accessible wherever decisions and actions happen.
Grounded in the physical building
Real systems.
Connected intelligence.
Measurements, equipment and service delivery — understood together, in the building they belong to.
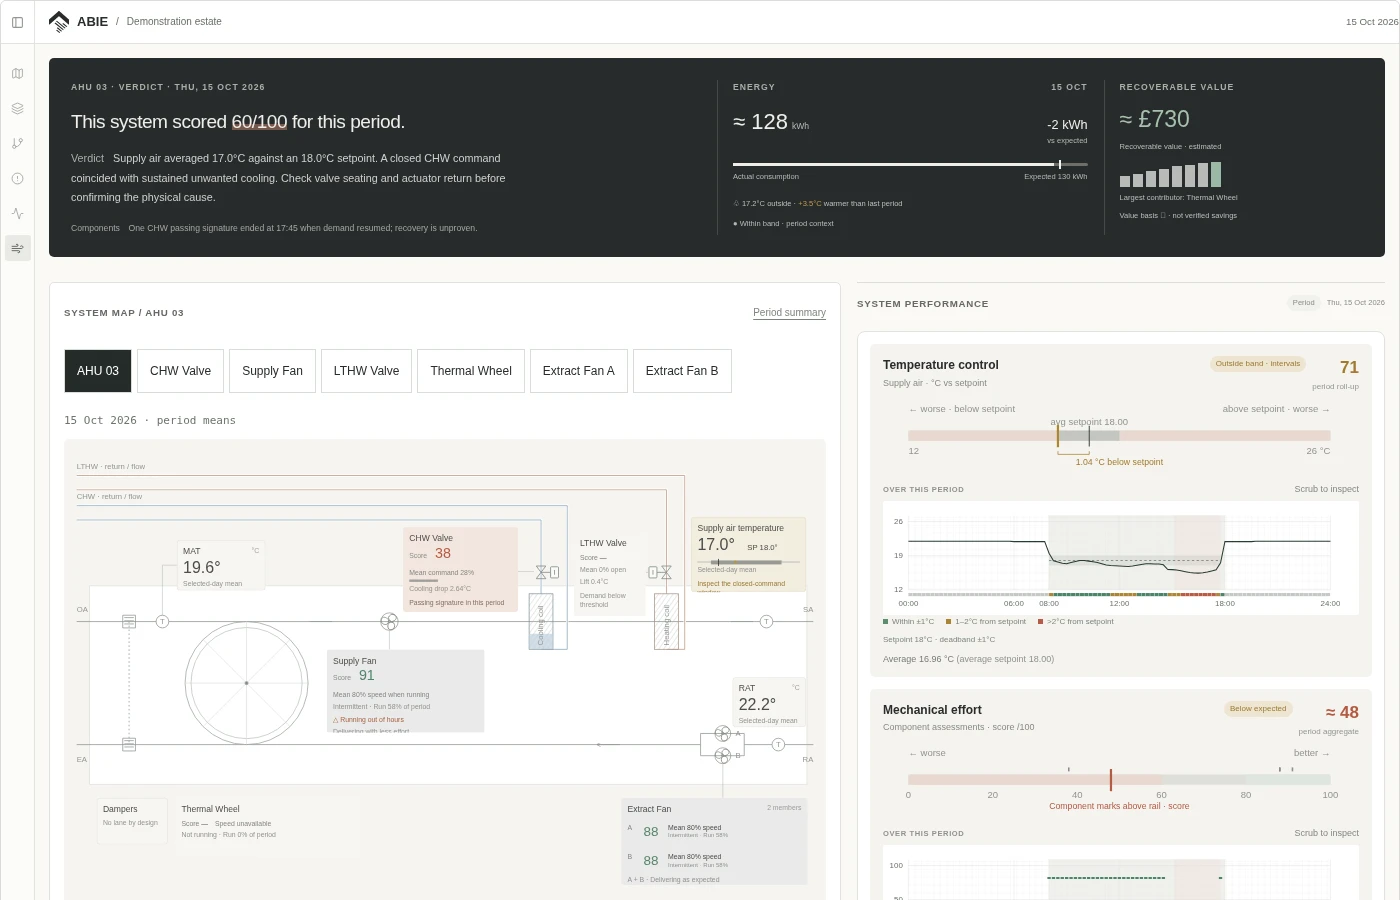
- Temperature control
- 71/100
- Mechanical Effort
- 48/100
Comfort below expectation. Mechanical effort elevated.
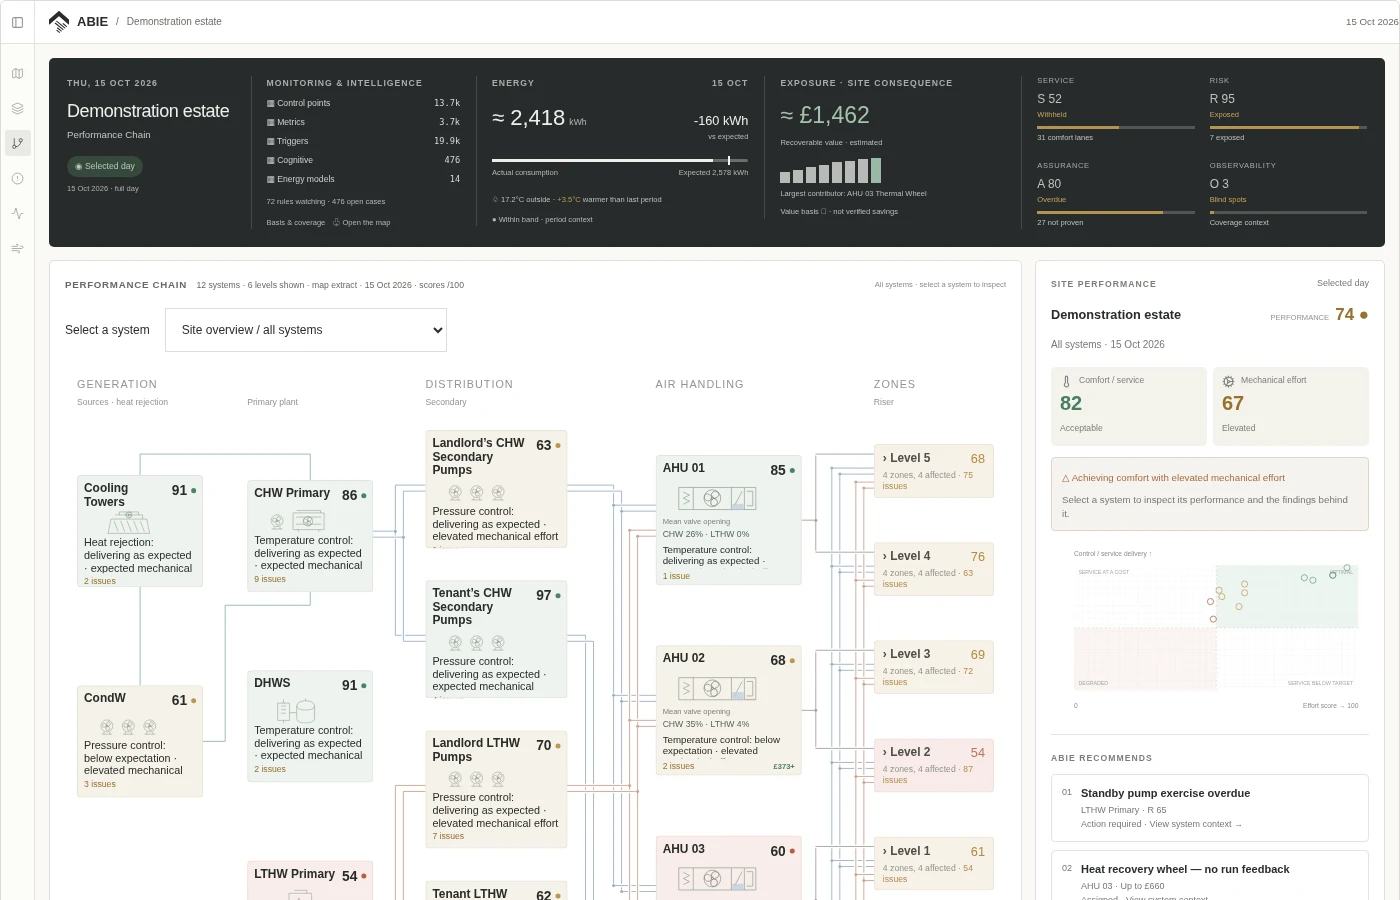
- Temperature control
- 88/100
- Mechanical Effort
- 84/100
Delivering as expected with expected mechanical effort.
- Pressure control
- 80/100
- Mechanical Effort
- 51/100
Pressure maintained with elevated pumping effort.
- Usage
- 28/100
- Efficiency
- 86/100
Excess usage. Cooling delivery within expectation when commanded open.
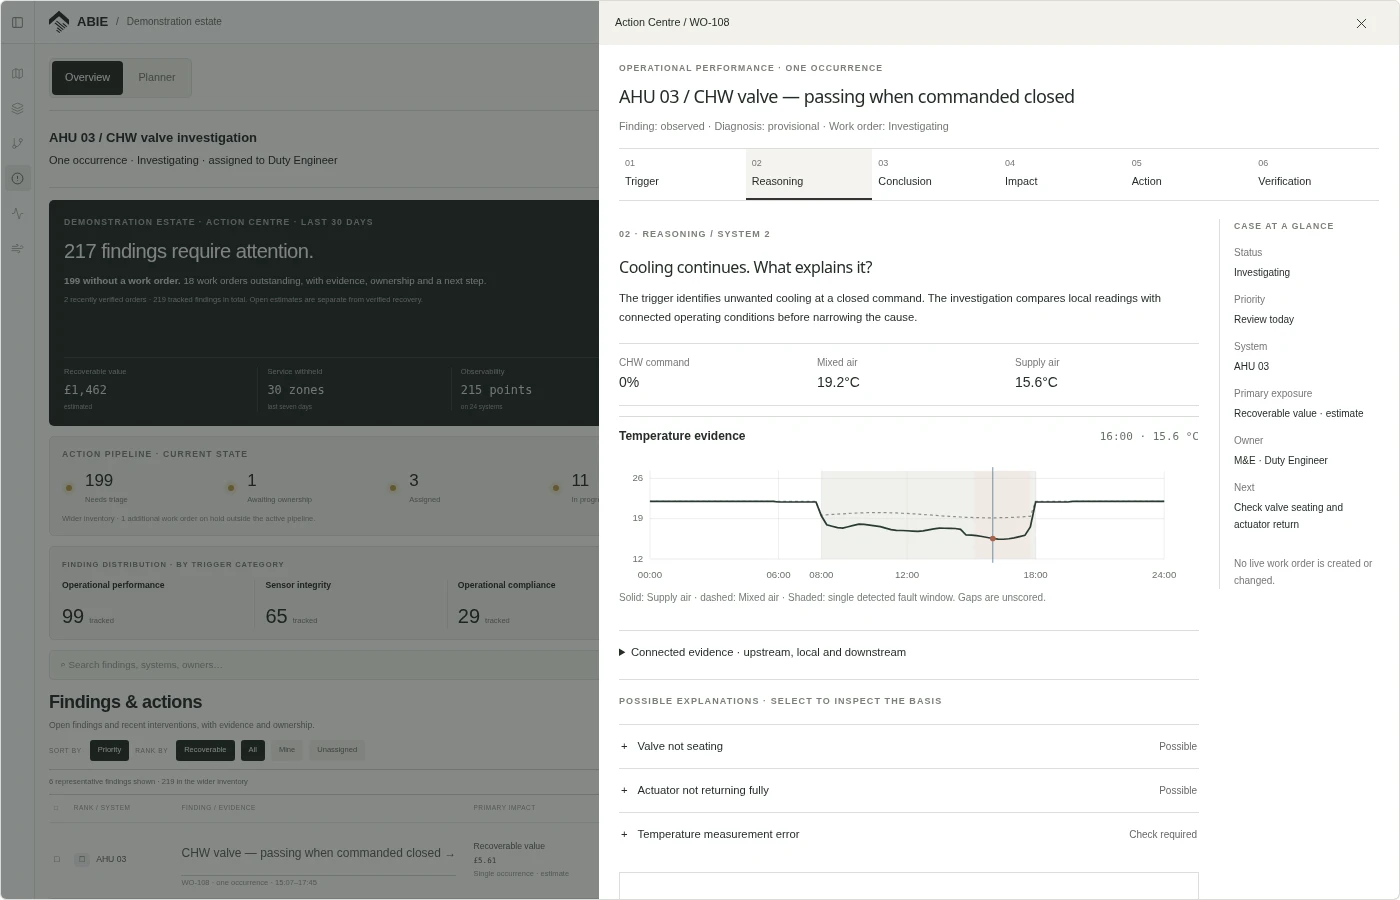
Closed command. Cooling persists.Detected 15:07 · physical cause provisional
Supply fan input: 1.85 kWh against 1.68 kWh expected in the selected 15-minute interval at 16:00. A component reference complements the system assessment.
Chillers, primary pumps and controls are evaluated as a functional system. Their performance supplies context for the downstream AHU investigation.
The secondary pumps distribute chilled water to connected systems. Pressure control is delivering as expected, while Mechanical Effort indicates that the system is working harder than expected. These assessments provide context for investigation; they do not establish a physical cause.
Usage compares allocated thermal input with expected demand. Efficiency assesses cooling temperature drop during commanded-open operation. These are day scores: Efficiency is unscored during the closed-command fault window, where temperature evidence supports investigation.
Off-state sensor agreement points the investigation to the valve assembly. Valve seating and actuator travel still need physical checks to distinguish the cause.
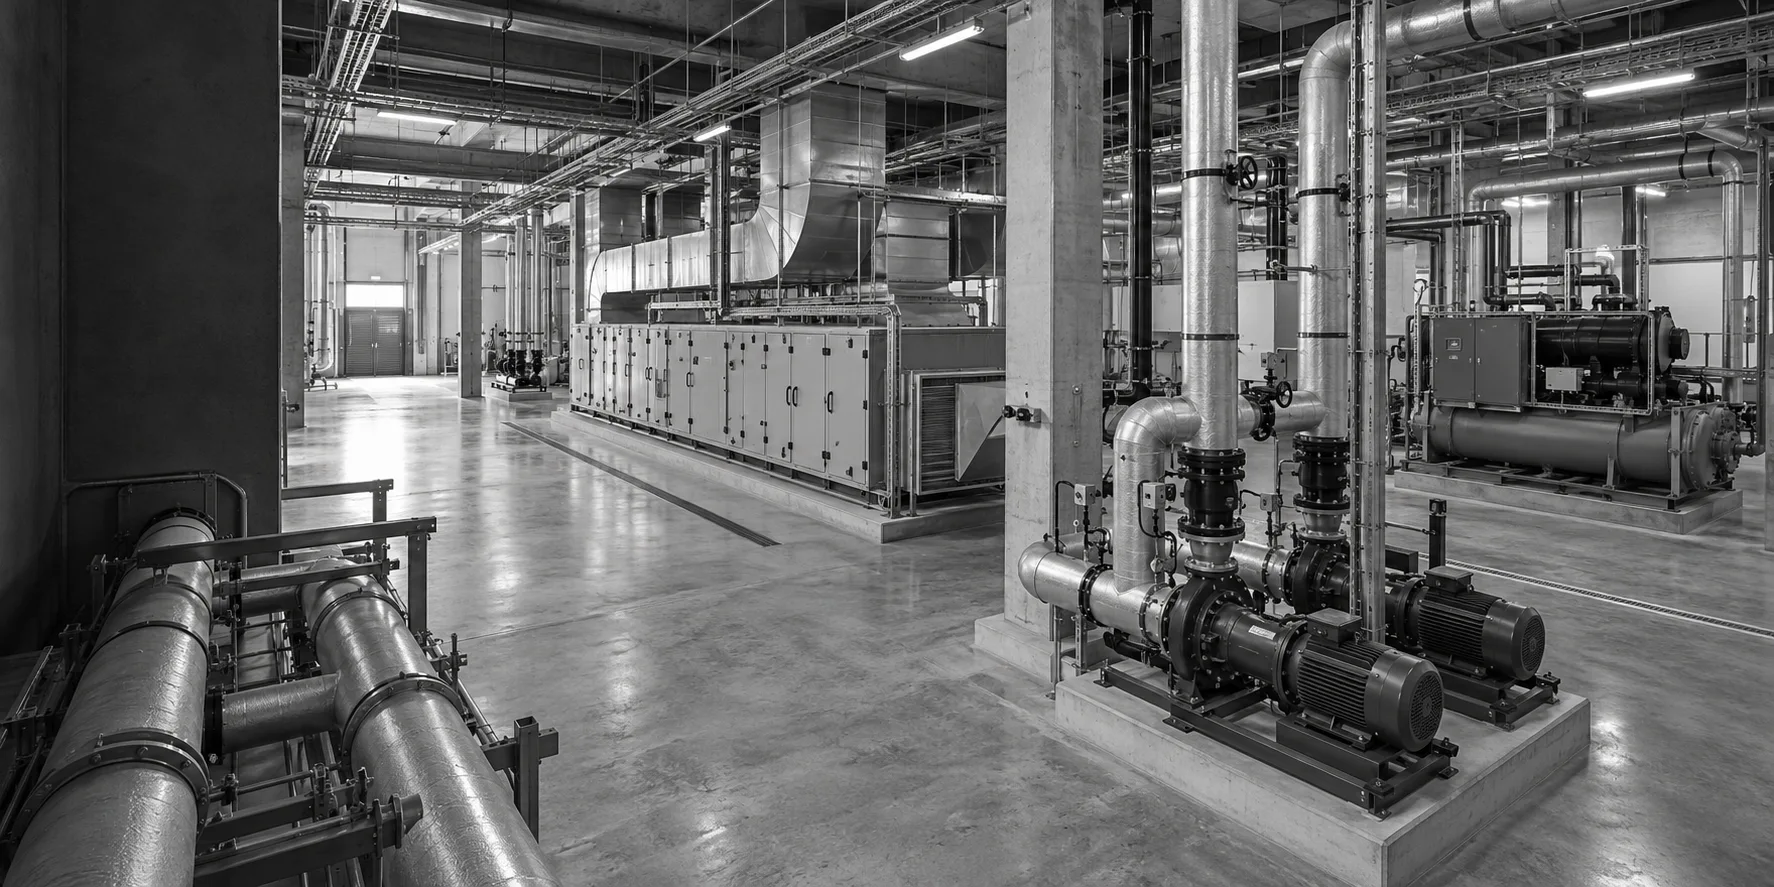
Plant-room performance in context.
NextThe intelligence behind ABIE
Different engines.
One continuous understanding.
Follow the path from collected measurements to performance assessments, investigations and verified action.
Read about the eight ABIE engines
ABIE Node
ABIE gathers information from the building’s existing control systems, creating a continuous view of how its equipment is operating. This happens without ABIE needing to take control of the building.
Explore ABIE NodeSystem Map
Every major system has an interactive diagram of its equipment and connections. Familiar operating readings sit alongside performance assessments, showing what equipment is doing and how well it performs. Select a component to investigate, or rewind to see what changed and how it contributed.
Explore System MapPerformance Chain
One problem can create symptoms across connected systems. ABIE investigates their relationships, possible causes and consequences using operating evidence. This helps teams prioritise what matters, rather than simply respond to a fault list.
Explore Performance ChainMetric Engine
Equipment does different jobs. ABIE assesses each using the right engineering method, then expresses the results in a consistent language — so you can understand how equipment, systems and the building are performing.
Explore Metric EngineEnergy Models
Energy consumption changes as buildings respond to weather, occupancy and demand. ABIE compares actual energy use with what would reasonably be expected under similar conditions, helping identify unusual consumption and opportunities for improvement.
Explore Energy ModelsCognitive Engine
Detecting unusual operation is only the beginning. ABIE investigates possible explanations, examines the supporting evidence and considers how the issue may affect connected systems. This helps distinguish symptoms from likely causes and identify what deserves attention.
Explore Cognitive EngineComposer
ABIE can assess thousands of measurements and relationships, but people need to understand what those findings mean. Composer brings the evidence together and explains what’s happening, why it matters and what needs attention — in clear, useful language.
Explore ComposerAction Centre
ABIE brings findings, consequences and evidence together so teams can decide what needs attention. Work can then be assigned, investigated and resolved — with performance checked to establish whether the intervention worked.
Explore Action CentreOperational assessments and diagnostic reasoning use defined engineering methods. AI-assisted preparation does not establish findings or replace commissioning. Conclusions depend on the available measurements and configured evidence checks.
Connected-system performance: the Performance Chain Model · The Continuous Audit · Diagnostic reasoning: the Psychology of Insight · Evidence and methodology sources
The ABIE Platform
Explore ABIE
in practice.
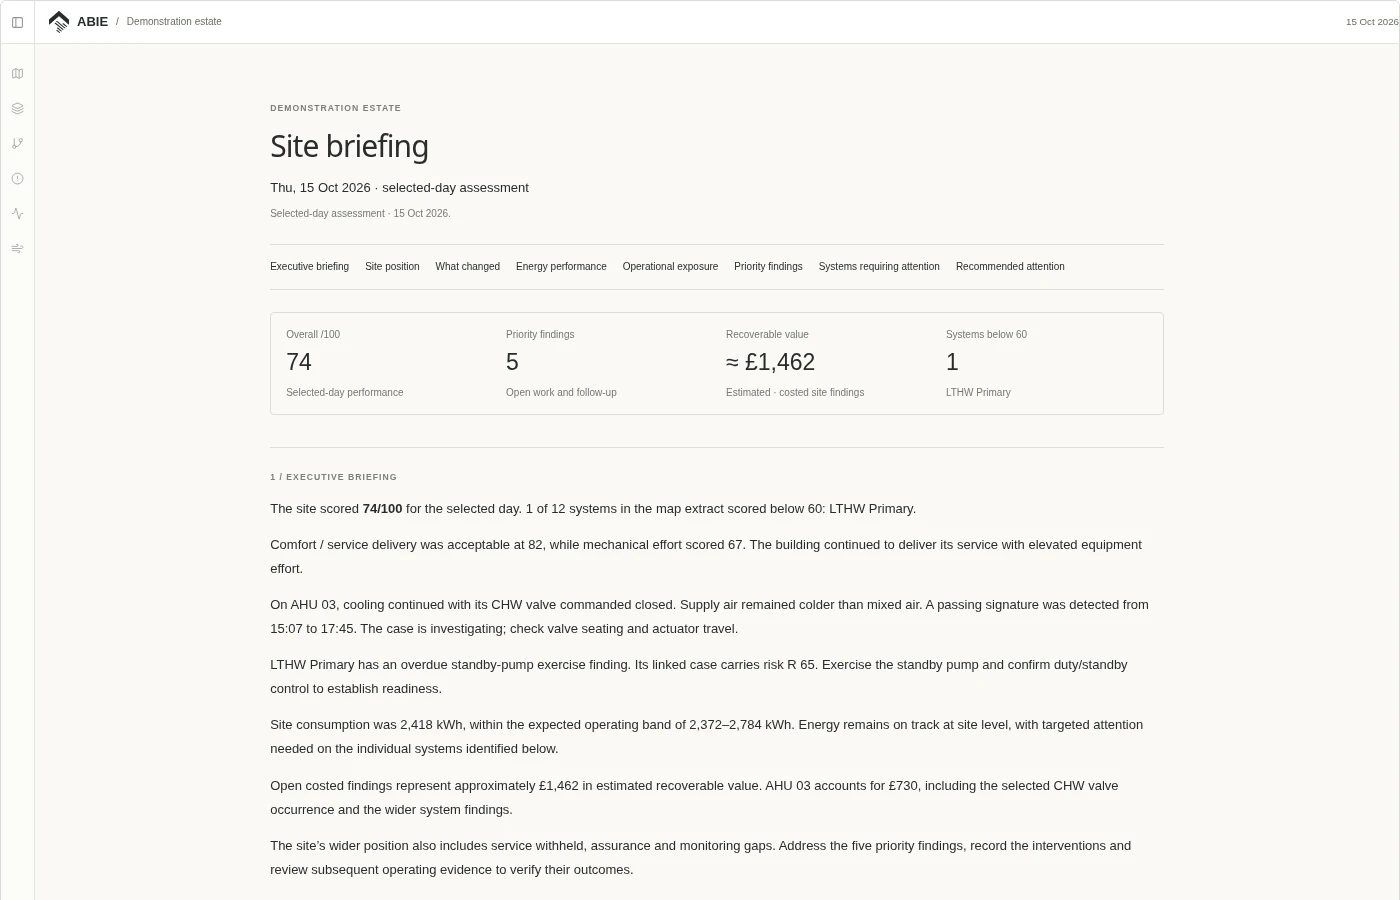
Follow AHU 03 from its place in the building to an investigation, corrective work and the next site briefing.
Interactive platform walkthrough · one connected case.
Scroll within this view to explore.
Intelligence beyond the dashboard
Building intelligence,
wherever it’s needed.
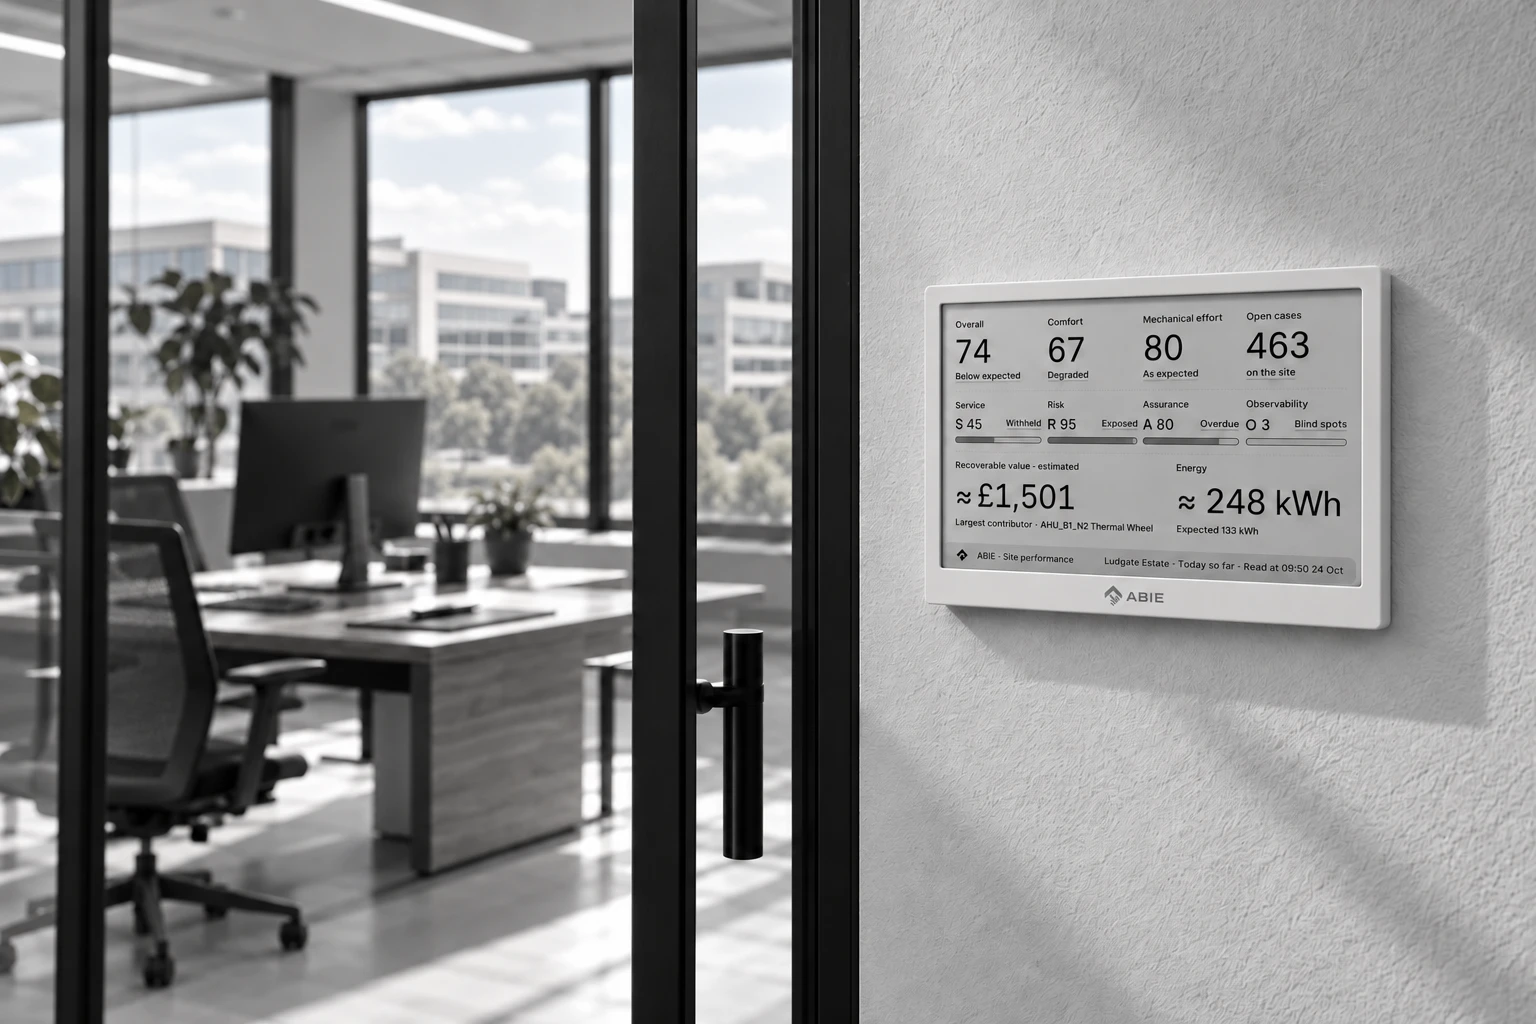
ABIE eDisplay
Your building’s performance.
Always in view.
A 7-inch e-ink display shows site performance, operational exposure, energy and outstanding issues without opening the application.
- Persistent visibility
- Site information remains visible between refreshes.
- Low-maintenance operation
- Battery life: 3–6 months, depending on refresh rate and usage.
- Flexible placement
- Desktop or wall-mounted, with ABIE-branded enclosure options.
Periodically refreshed information, rather than a live alarm panel.

eDisplay shown with ABIE enclosure branding in edited office settings; authentic application screens.
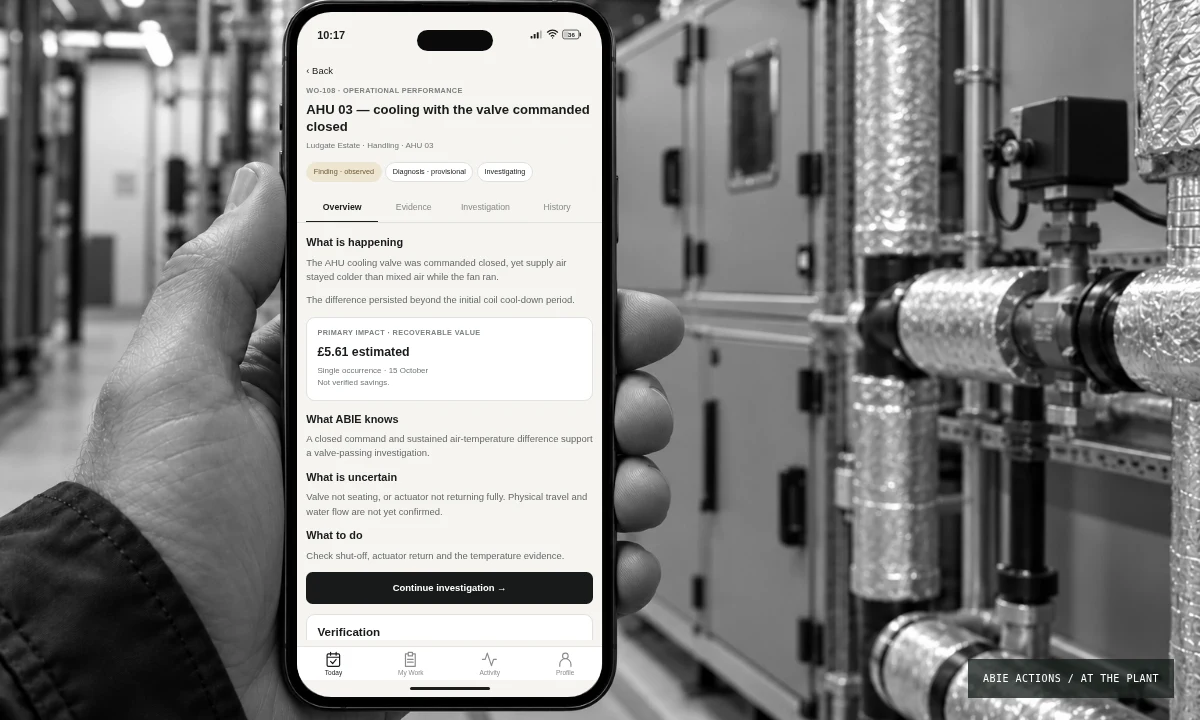
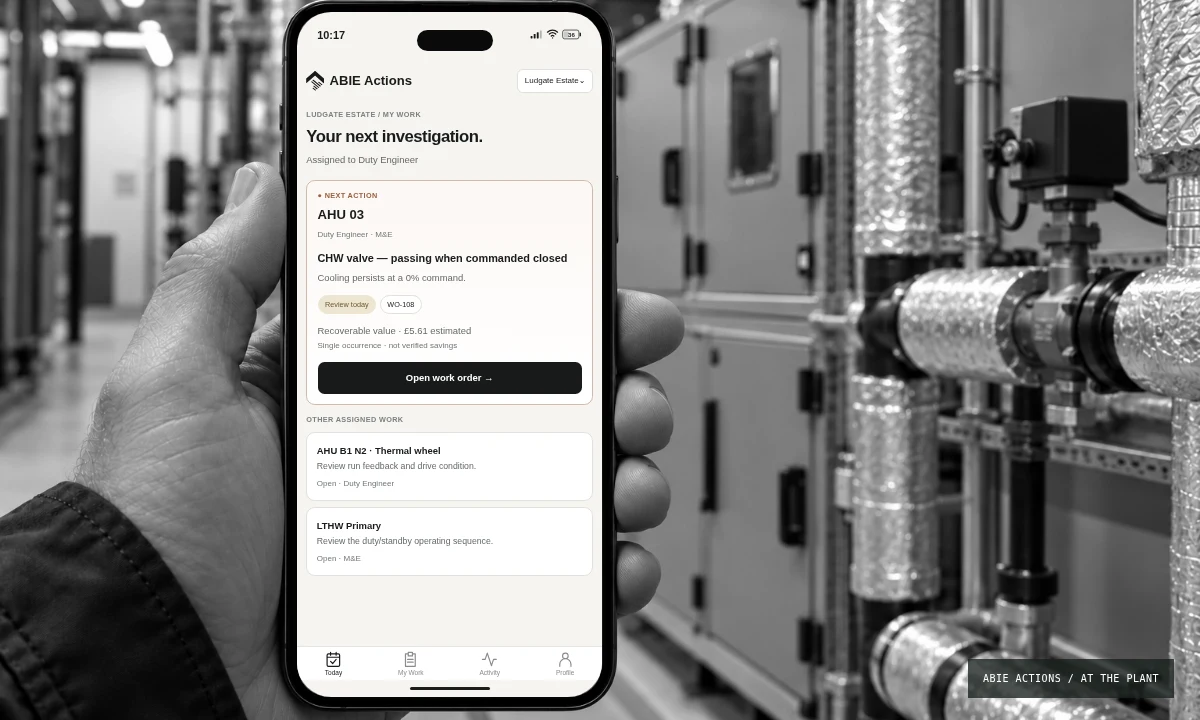
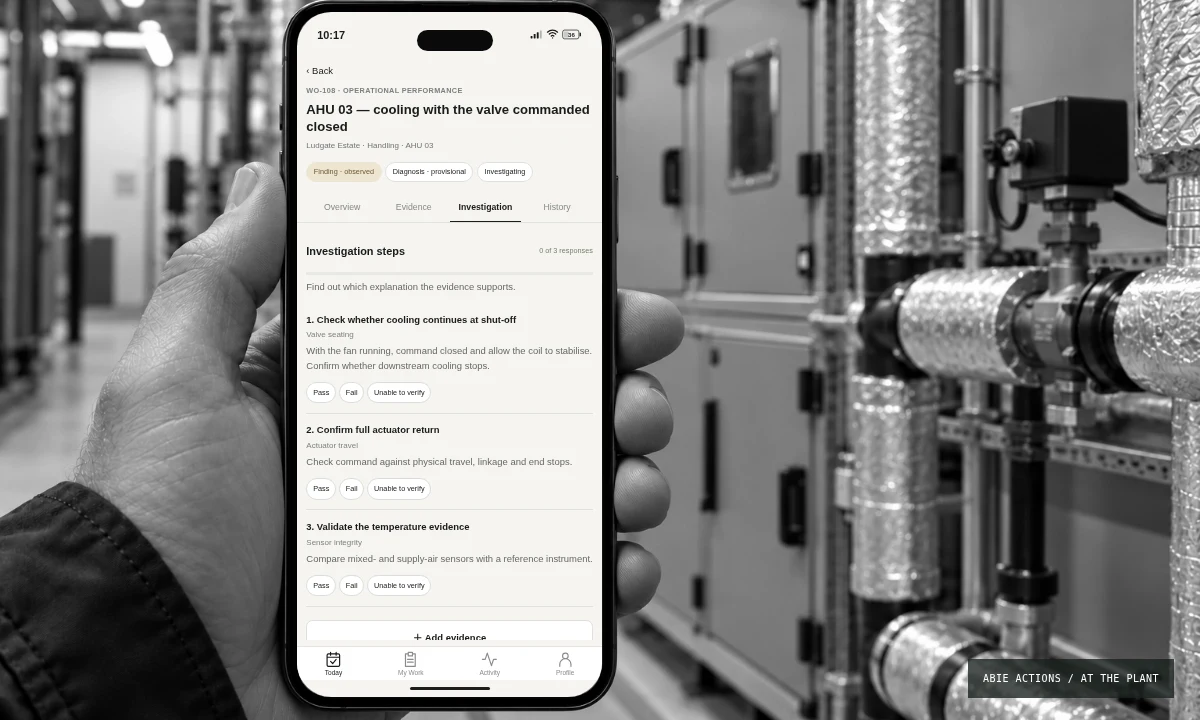
ABIE Actions Mobile App
From detection to action.
Wherever the work happens.
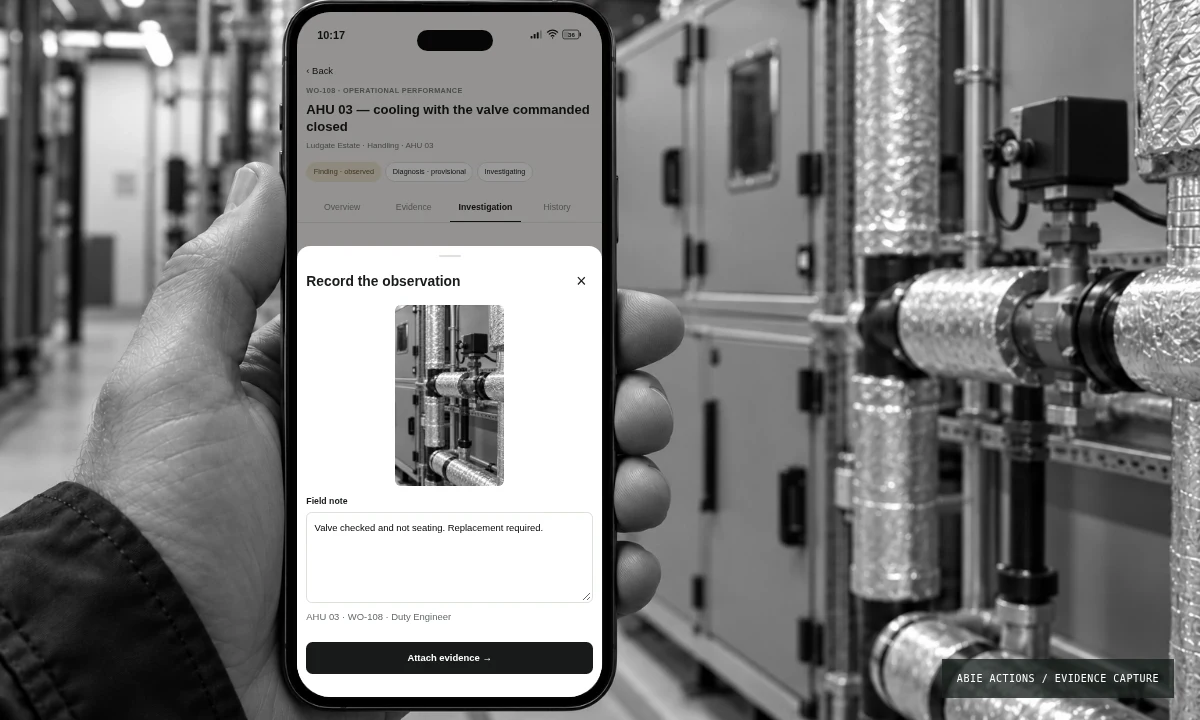
Follow an operational finding from the Action Centre into the hands of an engineer investigating the issue on site.
Assign the work, examine the evidence and bring photographs and observations back to the same investigation.
Getting started / From connection to insight
From connection
to understanding.
Once your order is placed, we connect to your existing infrastructure and configure ABIE around your equipment, operating requirements and people. These eight stages take you from onboarding to go-live.
Your route to a Continuous Audit.
Connection to go-liveAn average of four weeks.
Timing varies with site size, complexity and the information available.
Recording from day one
Data recording starts as soon as we connect. Early analysis becomes available as assessments are ready, and findings are backfilled over the recorded history as configuration and commissioning progress.
Your order starts the onboarding process.
We agree access with your site team, set up the connector and bring together the information needed to understand your equipment and its intended operation.
- Set up the connector and start recording operational data.
- Deliver or send out your ABIE display.
- Gather O&M manuals, descriptions of operation, line diagrams, equipment schedules, plant ratings and available readings.
Onboarding can take place on site or remotely, depending on the installation.
Existing BMSConfigured information
→ABIE NodeRead-only collection
→ABIE PlatformOperating evidence
Connectivity & technical requirements
Existing infrastructure, agreed interfaces.
Deploy the ABIE Node on an edge device or as a Windows service on the BMS machine. Supported Niagara / Haystack, BACnet and MQTT interfaces are assessed and configured for the installation. Compatibility and available measurements determine the initial assessment coverage.
Read-only, with site IT approval.
Operational data is acquired without issuing control commands or changing setpoints. The existing controls remain responsible for the building. Suitable access arrangements and the relevant site interfaces must be approved and configured.
Secure outbound communication.
The Node initiates an encrypted connection to the ABIE Platform from inside the building network. The platform does not initiate an inbound connection to the Node. This does not require unrestricted network access.
Continuity and appropriate scope.
Readings are buffered locally during an internet interruption and sent when it returns. Available historic trends can be imported after validation. Access is scoped to the appropriate organisation and sites. The ABIE Platform is accessed through a web browser. Collection covers agreed operational data, not video, access-control records or personal data from the building.
Every building starts somewhere. Tell us about yours.
What might ABIE cost
for your building?
Start with your equipment or total BMS point count. Add each building, then request an indicative proposal based on its systems and available information.
Your buildings
The Continuous Audit / delivered through ABIE V2
Make performance
accountable.
Connect operational evidence to an engineering judgement, a clear action and an outcome that can be checked.